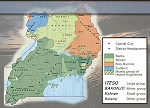
Cultural Ethnic Composition
Ethnic Group Distribution (click on image for a larger picture)
Facts about Uganda
| GNI, 2000 (US$, billions) | 6.7 |
| GNI per capita, 2000 (US$) | 300 |
| GDP, avg. annual growth rate, 1999-00 (%) | 3.5 |
| GDP per capita, avg. annual growth rate, 1999-00 (%) | 0.8 |
| Population, 2000 (millions) | 22.2 |
| Population growth rate, 1980-00 (%) | 2.8 |
| Infant mortality rate, 2000 (per 1,000 live births) | 83 |
| Under-five mortality rate, 2000 (per 1,000 live births) | 161 |
| Maternal Mortality Ratio, 1990-1998 (per 100,000 live births) | 510 |
| Life expectancy at birth, 2000 (years) Male Female |
42 42 42 |
| Primary school enrollment ratio, net, 1998 (%) | |
| Adult illiteracy rate, 2000 (% of population age 15 and over) Male Female |
22 43 |
| Prevalance of HIV, 1999 (%) Adults Young Male (age 15-24) Young Female (age 15-24) |
8.30 3.84 7.82 |
| Access to an Improved Water Source, 2000 (% of population) | 50 |
| Energy use per capita, commercial, 1999 (kg of oil equivalent) |
Copyright 2012 Asians from Uganda, all rights reserved.


